An Introduction to Google Analytics for E-commerce

Getting your e-commerce business off the ground is a daunting task. There are countless voices out there vying for your attention, and they’re all preaching strategies that sound important but don’t make a whole lot of sense to you yet. “Experts” are throwing around terms you’ve never heard of, and it makes the work you are doing feel inadequate.
This blog is all about chipping away at that feeling of e-commerce inadequacy. We’re going to get you up and running with one of the most important tools in the game: Google Analytics.
If you aren’t using it already, you likely gave it a look but were intimidated by the sheer volume of information the tool makes available. There are line graphs, charts, loads of metrics, percentages, etc. Just the word “analytics” is enough to scare off those who struggled with math in high school.
But with thirty minutes of work and a bit of light reading, we’ll get Google Analytics for E-Commerce up and running with your SamCart Marketplace. We’ll also teach you about four simple reports that will help you gain insight into the performance of your next launch.
In this blog, you’ll learn about:
1. Integrating SamCart with Google Analytics E-Commerce Tracking
To start, you’ll need a Google account. If you’re signed into Google using Chrome, Gmail, etc., you can use that account. If not, you can register with Google here.
Next, head to Google Analytics and sign up using your Google account.

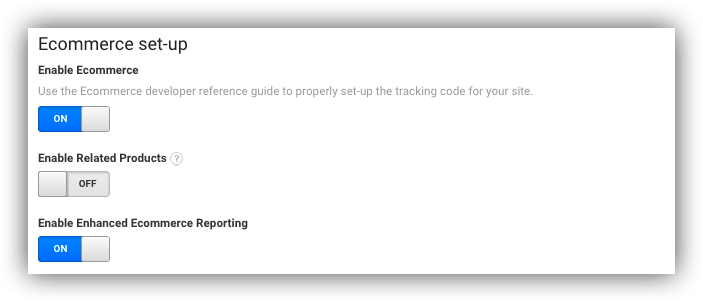
On the following screen, select Website and fill in the rest of the required information. Click Get Tracking ID and you officially have a Google Analytics account! Not so bad, right? Your shiny new Google Analytics account won’t have e-commerce tracking enabled by default, however, so let’s get it turned on. Head to your Google Analytics home page and click Admin in the menu bar. Next, select the Account, Property, and View that you want to track and click Ecommerce Settings:

Switch the Enable Ecommerce and Enable Enhanced Ecommerce Reporting toggles to “ON” and you’re good to go!
Your account is now primed and ready to track e-commerce data. Head back to your Home tab in Google Analytics, click on Tracking Info under Property, and select Tracking Info:
On the following page, copy the block of code under Global Site Tag (gtag.js). It will look something like the following:

Once that's copied, head over to your SamCart Dashboard and open your Settings. Under your General Marketplace Settings (the first page that opens after clicking Settings), find Embed HTML/Scripts and paste your Global Site Tag in the corresponding field:

This will inject the tracking script in the footer of all your products. After it's pasted, click Save Changes. We're almost there! Once you've injected the script into the footer of all your checkout pages, continue scrolling down the General Marketplace Settings page until you see the Google Analytics eCommerce Tracking toggle. Switch that to “ON” and you're ready to start working smarter:
Getting set up with Google Analytics was easy, but what to do with all this new information? There’s a ton to unpack here, but it’s important just to focus on the basics when you’re first starting out. There is plenty of actionable data in these basic reports that your competitors are likely ignoring, so don’t get in over your head too soon. Record your findings, have a brainstorming session, and take action. Let’s dig in...
2. Real-Time Reports
Real-time reports show you, unsurprisingly, what’s happening on your page in real time. These reports can be a bit gimmicky and aren’t overly useful for making long-term strategic decisions, but they’re my favorite thing about Google Analytics and a fantastic starting point. Launching your Product out to the world and watching the traffic flood in in real-time is genuinely addicting and feels like cutting the ribbon on a brick-and-mortar store. This thing you’ve worked incredibly hard on is now live, and you get to sit and watch potential customers visit your page and decide if they want to buy. Trust me, you’ll be hooked... [caption id="attachment_4642" align="alignnone" width="561"]

Real-Time Reports offers a ton of insight into who's currently on your page.[/caption] To view your Real-Time reporting, find Real-Time in your navigation bar and click Overview. That will give you the most complete picture available of real-time traffic and will break down how many users are on your page, their location data, and Pageviews per minute/second. If you’re in the midst of your first few launches, this view is probably all you need from the Real-Time report. There is literally no better tool available for judging the immediate success of a launch, post, or email from a traffic generation perspective. If you’d like to dig a bit deeper than what’s available on the Overview page, you can narrow your Real-Time data to focus on just Locations, Traffic Sources, Content, Conversions, and Events. When you’re first starting out, it might take a few launches for Google to aggregate enough for the other reports to be actionable, so take it slow and spend some time getting used to the Real-Time Report before moving on.
3. Audience Reports
Audience Reports provide details into who your page’s visitors are, and are a perfect next step now that you’ve gotten some data flowing into your Google Analytics account.

The various reports found here provide insight into your visitor demographics (age, gender), geography (language, location) and even the devices they're using to view your page (Mac vs. PC, desktop vs. mobile). There are a number of views here as well, but try sticking with the Audience Overview at first. This breaks down the total number of visitors to your page(s), new vs. returning users, as well as metrics on:
- 1. Sessions: The total number of times each visitor has engaged with your page.
- 2. Users: The number of unique visitors to your page. Each visitor will only count once.
- 3. Average Session Duration: The average length of each user's visitors session.
- 4. New Users: The percentage of total users who visited your page for the first time.
There are other metrics available here, such as Pageviews, Pages per Session, and Bounce Rate, but they’re not particularly useful if you’re selling Products via SamCart. You’ll also find metrics here detailing your visitor’s Language, Country/Territory, City, Browser, Service Provider, Operation System, Mobile Operating System, Mobile Service Provider, and Mobile Screen Resolution. There are countless things that you can do with this information, but start by looking at metrics such as location data and making decisions based on your findings. If the majority of your visitors are from outside the United States and your target market is customers in the United States, you know you need to change your messaging and possibly your ad targeting. If your customers are predominantly viewing your content on mobile browsers as opposed to desktop browsers, keep that in mind when you’re creating marketing material for your SamCart checkout pages. Images that your customers need to squint to see on an iPhone aren’t going to help you convert your visitors into customers! The possibilities here are basically endless, and once you’re comfortable with the basics you can start segmenting your audiences and comparing them against one another to gauge performance.
4. Acquisition Report
As your business grows and you expand your number of marketing channels (blogs, emails, social media posts, etc.), the Acquisition Report becomes profoundly useful as it breaks down how your visitors found you and how they arrived at your page.

It’s a bird’s eye view into your traffic generation tactics that spells out exactly what to focus on and what to cut out. As you learn to read this report, you’ll begin to notice which marketing funnels are driving the most visitors and, more importantly, which channels drive visitors who buy your stuff. If you have SamCart Affiliates promoting your pages, this report is absolutely critical to you as helps you identify trends in what promotional channels are working for your Affiliates. You’ll be amazed by what you can learn from how other people are selling your products!
5. Conversion Reports
We saved the best for last! Conversions is either the most gratifying or most stressful report Google has to offer, depending on how many sales you have coming in. Once you’ve gotten comfortable with Google Analytics and are making a steady stream of sales, Conversion Reports are likely going to be your most frequented page. Conversion Reports offers you data about the Products your customers purchased, how many they purchased, when they purchased, and the revenue generated from your sales. You can even get a glimpse into your customer’s Time to Purchase, or the number of sessions and days it took for your customer to make a purchase. This helps you gauge how well your pages are creating urgency with your customers. Try bringing scarcity into the fold if your customers are waiting too long to purchase! As obvious as it seems, Conversion Reports are also tremendously helpful in helping you identify your most successful products. Figuring out what your customers are purchasing helps you hone in on your niche, and is a safe way to assess where to spend your marketing and product development time and money. Finally, if your revenue per transaction is lacking, consider adding a One-Click Upsell and Order Bump to your products. If you’re not constantly increasing the value of your customers, you’re not taking full advantage of SamCart.
You Can’t Manage What You Can’t Track
In e-commerce, one of the most dangerous things you can do is make decisions based off hunches, advice from “experts,” and tradition. What worked for someone else might not work for you, and the only way to make truly informed decisions is with the right tools and data. Thankfully, as uninviting as those tracking scripts and graphs look, this stuff just isn’t that complicated. Get in there, collect some data, write everything down, and draw just one or two educated conclusions about your findings. You’ll be surprised by what you’ve been overlooking!
See a Live Demo Of SamCart
In the last 12 months alone, SamCart Sellers have sold over $257 Million of their own products and services on SamCart. Find out why by checking out this live demo of SamCart today! Click below, and jump right into a SamCart account and see how this simple tool is helping thousands of business owners save time, capture more customers, and sell more products than ever.

.png)